
Figure 3.
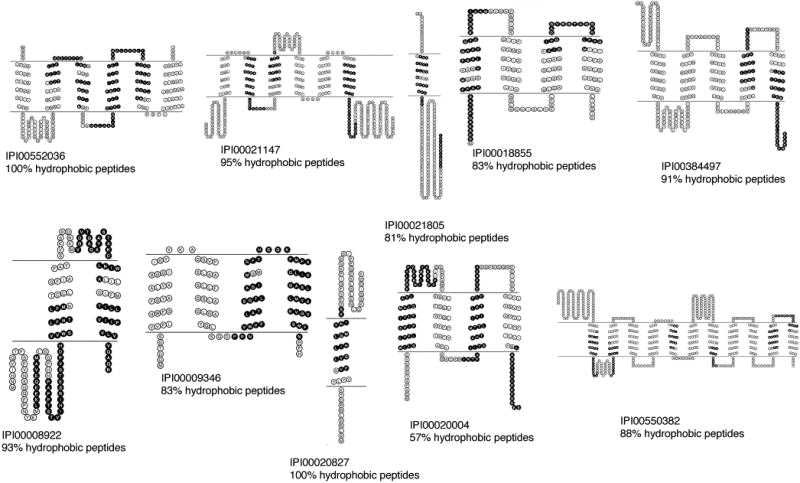
Topological maps of representative identified proteins. Ten IMPs identified in the MEP MudPIT analyses with sequence coverage shown in black. The diagrams show the predicted protein topology, with predicted TMDs located between the black lines for each protein. The percent of hydrophobic peptides (with GRAVY score >0) for each protein is listed. IPI numbers from IPI database downloaded April 2007.