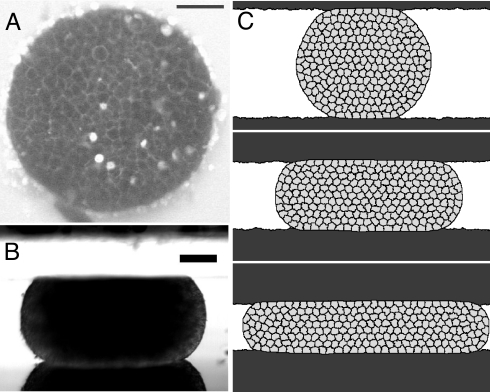
Fig. 1.
Shape of aggregates. (A) Top view, two-photon microscopy image of the middle plane of a F9 aggregate at a 27% compression rate between parallel plates (see also Fig. S1). (Scale bar, 50 μm.) Cells are alive and moving (SI Text and Movie S1). (B) Side view, in a stereomicroscope (SI Text). (Scale bar, 125 μm.) (C) Simulation of three successive compressions.

