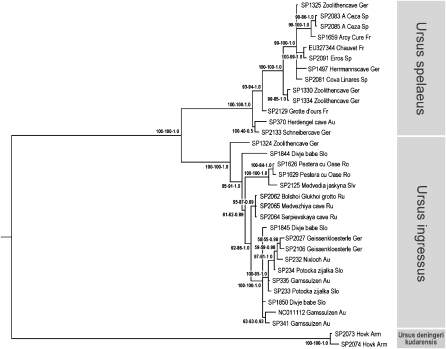
Figure 3.
Phylogentic relationships among cave bears. Numbers on branches represent neighbor-joining and maximum-likelihood bootstrap support values and Bayesian posterior probability. The tree is based on 9.6 kb of aligned mtDNA sequence and is rooted with brown bear as the outgroup (branch not shown). Abbreviations behind sample names indicate country of origin (see Supplemental Table S2).

