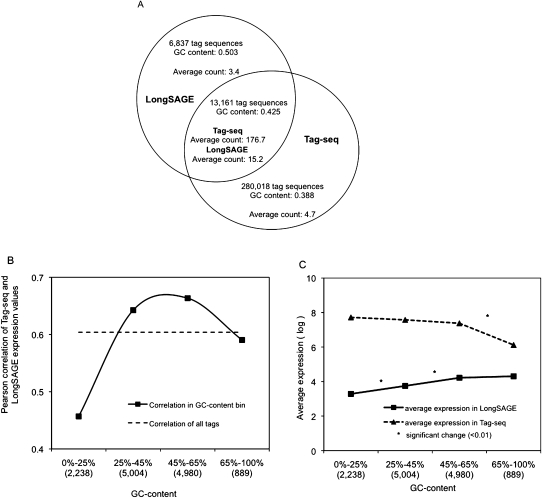
Figure 4.
GC-content biases in Tag-seq and LongSAGE technical replicate libraries. (A) Comparison of the GC-content and average count of tag sequences found either in common or by each of the Tag-seq and LongSAGE replicate libraries. (B) Pearson correlations were calculated for tags binned by GC-content. Bins are labeled with the range of the observed GC-content, and the number of binned tags (x-axis). (C) Average expression of tag sequences in each GC-content bin was calculated for both Tag-seq and LongSAGE, and the log of each average was plotted. An asterisk (*) denotes bins between which the expression of tag sequences was significantly different (measured using a t-test, P < 0.01).

