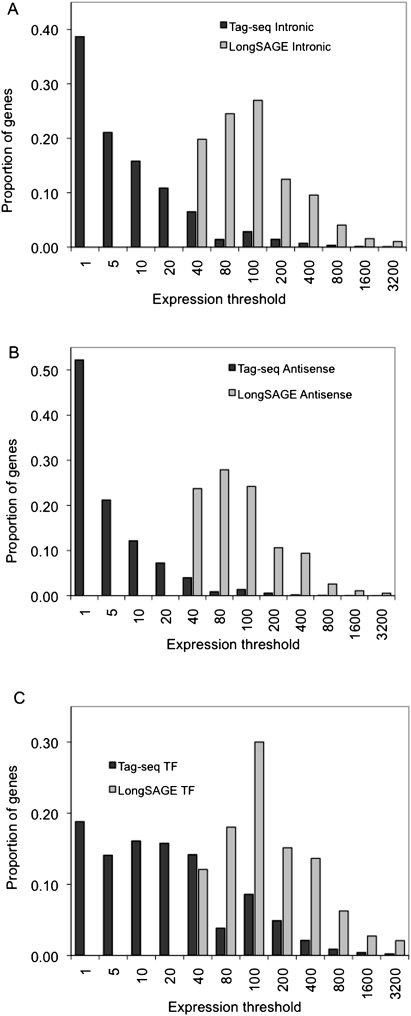
Figure 5.
The proportion of the average number of genes detected by tags in LongSAGE and Tag-seq libraries is shown at a series of expression thresholds (tags per million). Bars represent the proportion of the average number of genes with intronic tags (A), antisense tags (B), and DNA-binding domains (transcription factors) (C) in Tag-seq and LongSAGE libraries.

