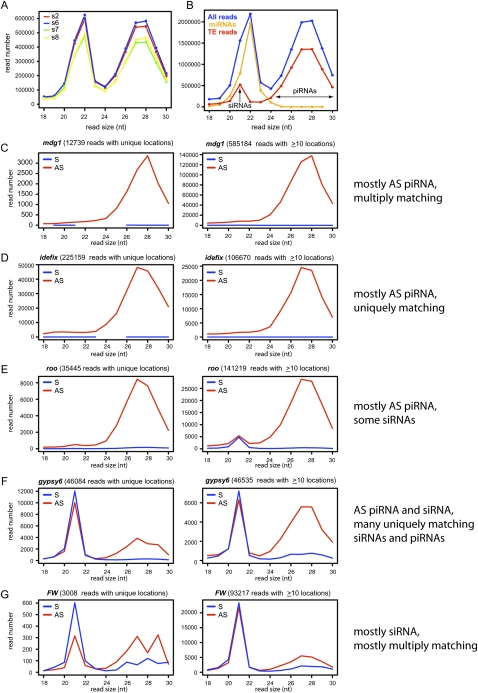
Figure 3.
TE-piRNAs and TE-siRNAs in OSS cells. (A) Reproducibility of overall read distribution in the four OSS sequencing reactions. Analysis of raw reads is shown; the normalized data are completely overlapping (Supplemental Fig. S1). (B) Combined OSS library data. Blue depicts the size distribution across all reads, orange depicts miRNA reads, and red depicts reads that mapped to transposons; the latter clearly segment into a siRNA population (peaking at 21 nt) and a piRNA population (∼24–30 nt). (C–G) Combined OSS read distribution mapped to various families of TEs (as annotated by RepeatMasker). (Red) Antisense reads; (blue) sense reads. Two graphs are shown for each TE family, depicting the size distribution of reads that map uniquely to the genome and the distribution of reads that map to the genome 10 or more times. Various patterns are observed across the TEs with respect to piRNAs vs. siRNAs, or the fraction of unique vs. multiply-matching reads. The complete analysis of all read bins across all TE families is available in Supplemental Figure S2.

