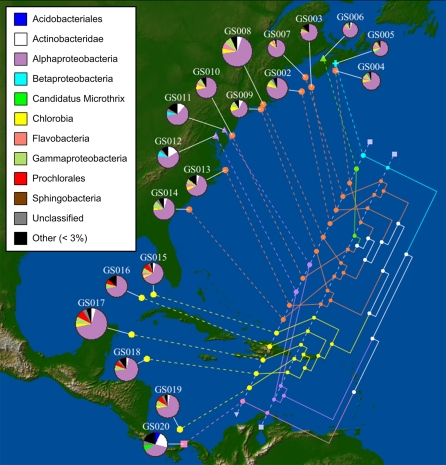
Figure 1.
Clustering of Global Ocean Sampling (GOS) sites based on their shared phylogenetic diversity. Pie charts associated with each GOS site show the breakdown of 16S sequences by best-matching bacterial class, with rare groups collected together in the “other” category. Pie chart sizes are proportional to the total number of 16S sequences considered at each site. The clustering of sites obtained by weighted UniFrac is shown in the tree, with habitat type indicated by shape and color (cyan cross indicates embayment; circles, oceanic, [with orange, Atlantic Ocean; with yellow, Caribbean Sea]; purple triangle, estuary with low salinity; green triangle, estuary with typical oceanic salinity; pink square, freshwater lake). White branches in the tree indicate internal edges whose children cover multiple habitat types.

