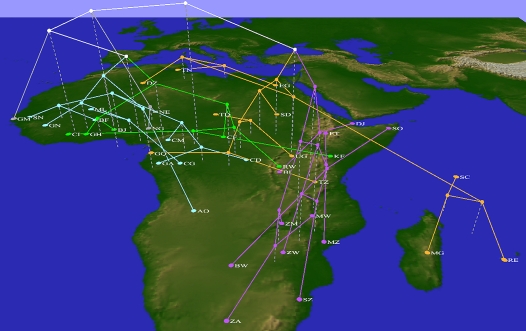
Figure 2.
Clustering of African nations based on phylogenetic diversity of HIV subtypes. The UPGMA clustering of countries based on their UniFrac scores is shown using a three-dimensional tree; the four subclusters discussed in the text and the countries they cover are indicated by coloring different subtrees orange, cyan, purple, and green. Location identifiers are mapped to the geographic center of each country, which is also identified with the standard two-letter country code.

