
Figure 2.
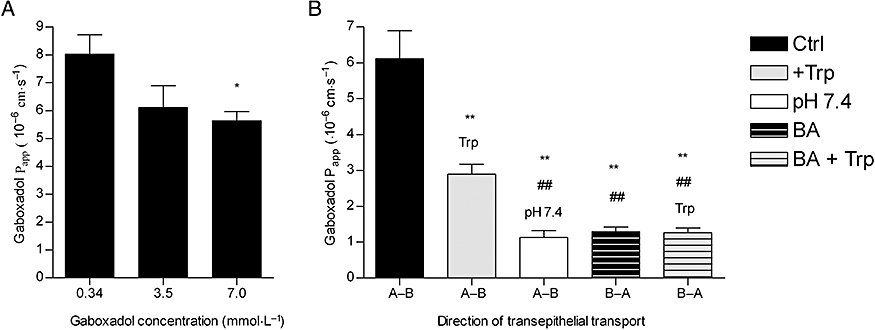
Transepithelial transport of 0.34, 3.5 and 7 mmol·L−1 gaboxadol across Caco-2 cell monolayers. (A) Apparent permeability coefficients, Papp, calculated from flux data (A–B) shown as a function of apical gaboxadol concentration. The apical pH was 6.0 and basolateral pH was 7.4. Statistically significant difference from the Papp of 0.34 mmol·L−1 gaboxadol observed by Student's t-test, *P < 0.05. (B) Papp of 3.5 mmol·L−1 gaboxadol at various conditions. Papp of 3.5 mmol·L−1 gaboxadol was measured in absence or presence of 35 mmol·L−1 tryptophan (Trp) at an apical pH of 6.0 and basolateral pH of 7.4 or at pH 7.4 at both sides. Each data point represents the mean ± standard error of the mean obtained in 3–4 independent cell passages. Statistically significant difference observed by Student's t-test: difference from 3.5 mmol·L−1 gaboxadol (A-B), **P < 0.005 or difference from 3.5 mmol·L−1 gaboxadol in presence of tryptophan (Trp; A–B), ##P < 0.005.