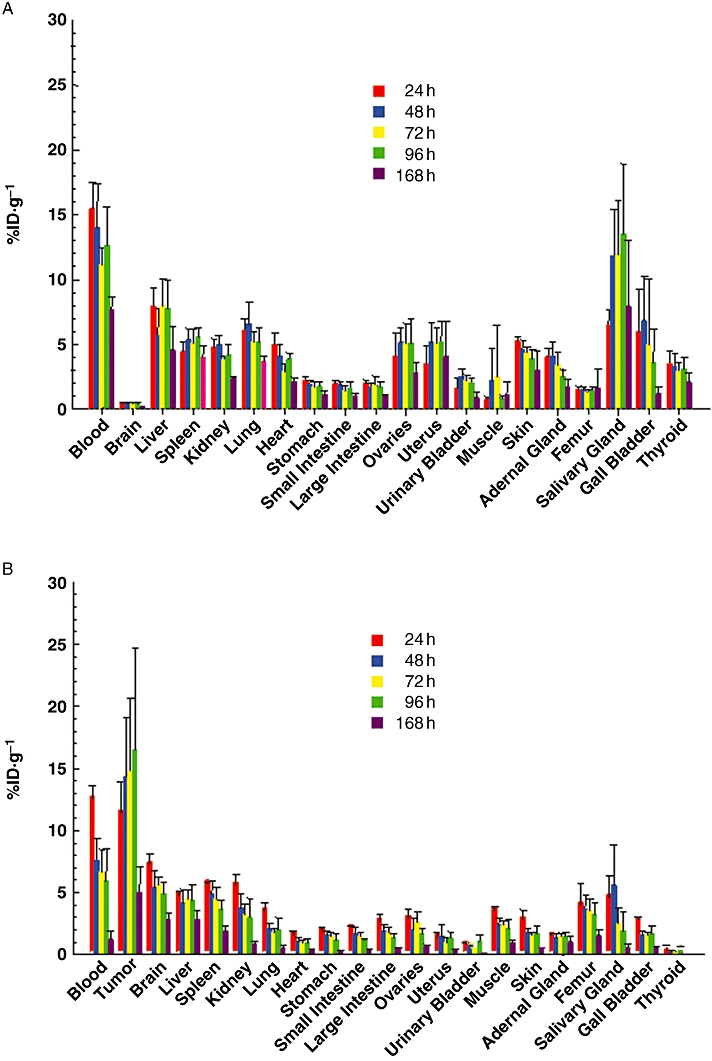
Figure 3.

Biodistribution of 111In-CHX-A″-panitumumab in tumour xenografts and normal tissues. Mice (n= 5) without tumour (Panel A) or bearing s.c. A431 xenografts (Panel B) were injected i.v. with 111In-CHX-A″-panitumumab (∼7.5 µCi). Mice were killed at the indicated times, when blood, tumour and tissues were removed, weighed and the radioactivity measured. The mean %ID·g−1 (percentage of injected dose per gram) with standard deviations are plotted.
