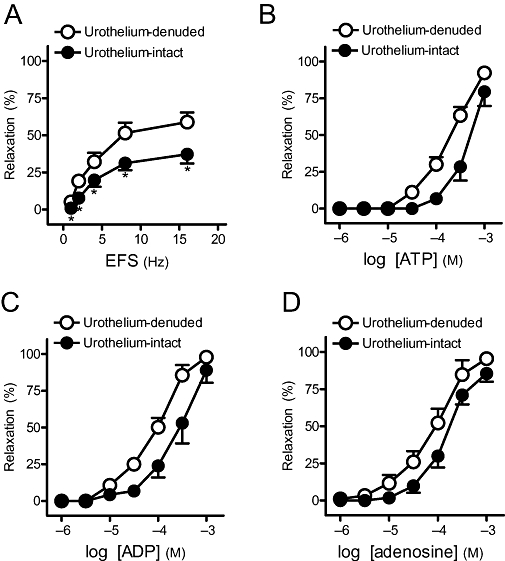
Figure 7.

(A) Frequency-response and (B,C,D) log concentration-response relaxation curves to adenosine 5′-triphosphate (ATP), adenosine 5′-diphosphate (ADP) and adenosine, respectively, in urothelium-denuded and urothelium-intact strips. Results are expressed as a percentage of the phenylephrine-induced contraction and represent mean ± SEM of six to seven preparations. *P < 0.05 versus control (unpaired t-test). EFS, electrical field stimulation.
