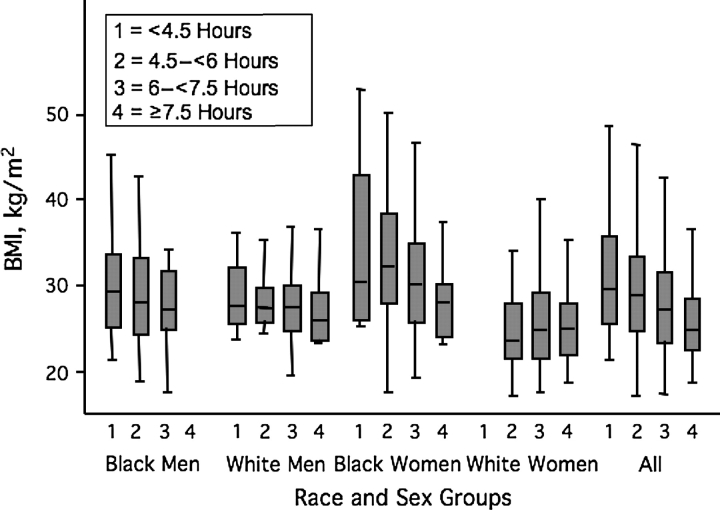
Figure 2.
BMI distribution by average actigraph-measured sleep duration, the CARDIA Sleep Study, 2000–2006. The gray boxes show the 25th, 50th, and 75th percentiles, and the tails show the largest and smallest values, excluding outliers. White women in the shortest sleep category (n = 2) and black men in the longest sleep category (n = 0) are not represented. BMI, body mass index; CARDIA, Coronary Artery Risk Development in Young Adults.

