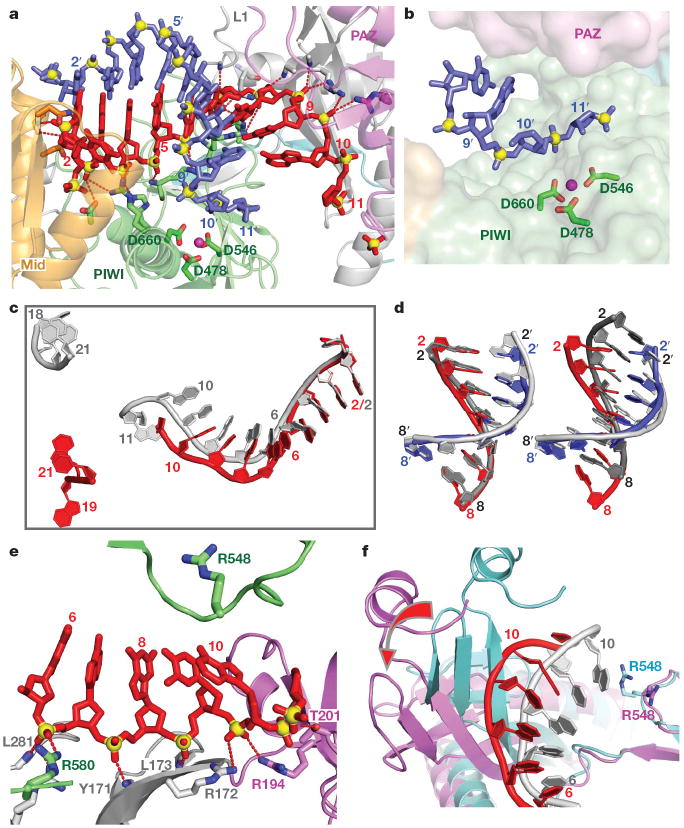
Figure 2. Comparison of structural details between the binary Ago complex with bound guide DNA and the ternary complex with added target RNA.
a, Expanded view of the ternary complex highlighting the guide DNA (1–10)-target RNA (1′–9′) duplex and Mg2+-coordinated catalytic residues (D478, D546 and D660) of the RNase H fold of the PIWI domain. Intermolecular hydrogen bonds between the Ago protein and the DNA guide strand in red are shown by dashed lines. b, Positioning of the sugar-phosphate backbone of the target RNA strand spanning the mismatch-containing 10–11-step relative to the catalytic residues of the PIWI domain. c, Comparison of the trajectory of traceable bound guide DNA in the binary (bases 1–11 and 18–21 in silver) and ternary (bases 1–10 and 19–21 in red) Ago complexes after superposition of their 5′-phosphate-binding pockets. d, Superposition of the guide DNA (red)-target RNA (blue) duplex spanning the 2–8 seed segment on A-form (left panel) and B-form (right panel) helices (silver) after best-fit superposition of the target RNA strand of the ternary Ago complex with one strand of the A/B-form helices. e, Positioning of stacked residues 6–10 of the DNA guide strand relative to R548, with emphasis on intermolecular interactions involving the sugar-phosphate backbone. f, Relative positioning of the 6 to 10/11 segment of the bound guide DNA strand and R548 in the binary (guide strand in silver, protein in cyan) and ternary (guide strand in red, protein in magenta) Ago complexes. The conformational change in the protein on proceeding from binary to ternary Ago complexes is indicated by a red arrow.

