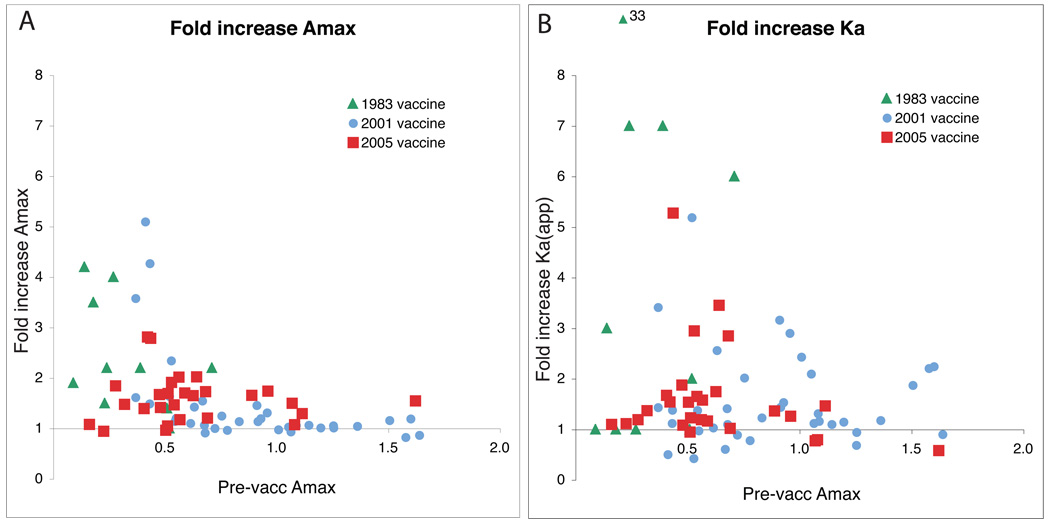
Figure 2. Fold increase in Amax is inversely related to pre-vaccination levels of antibodies.
Panel A plots fold increase in Amax against pre-vaccination Amax for the three studies.
Panel B is the same plot for fold increase in Ka. It shows that subjects with higher pre-vaccination levels of antibody may show an increase in avidity after vaccination, even though there is no increase in antibody amount.

