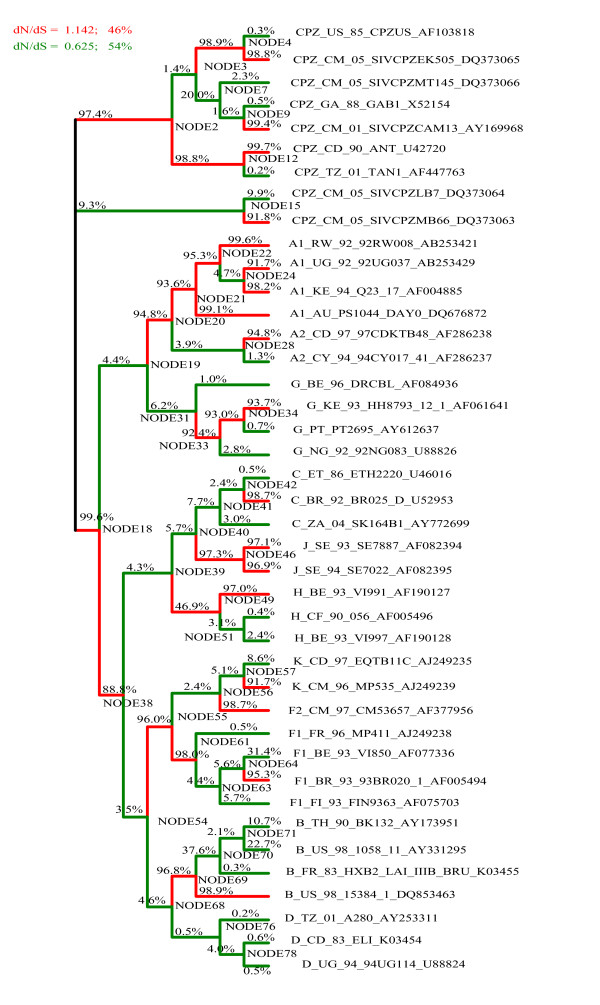
Figure 2.
Branch-by-branch selective pressure for regions predicted to be targeted by HLA-A*0201. The ω classes for each branch are shown in colours given in the legend, along with the ω value for each class and the percentage of branches falling in each category. The percentage of models that support dN>dS are written above each branch.

