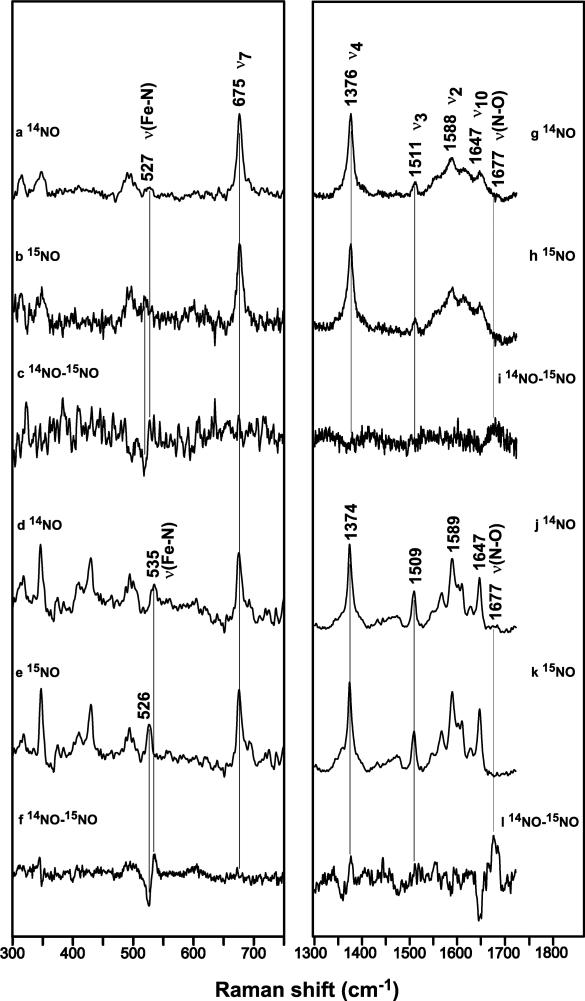
Figure 5.
Resonance Raman spectra of FeII-NO complexes of sGC heme domains. β1(1-194)-14NO and 15NO complexes and their difference spectra in the low- (a-c) and high- (g-i) frequency regions, respectively; β2(1-217)- 14NO and 15NO complexes and their difference spectra in the low- (d-f) and high- (j-l) frequency regions, respectively. Spectra were obtained with 400 nm excitation at 25 K. Data acquisition times ranged from 60-90 min.

