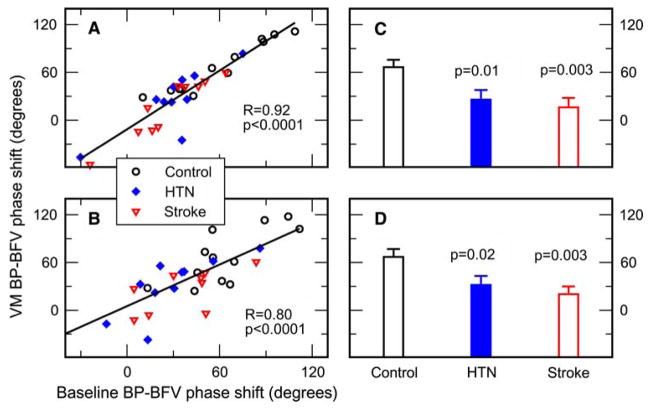
Fig. 2.
Comparison of the BP–BFV phase shift during two different conditions and between control, hypertensive (HTN), and stroke groups. (a, b) For each subject in this study, BP–BFV phase shifts for left (a) and right (b) side middle cerebral arteries (MCA) were measured during Valsalva maneuver (VM) and spontaneous BP oscillation under supine rest. The straight line is the linear regression fit of the data. The phase shifts during the Valsalva maneuver and baseline showed a strong correlation (left R = 0.92, P < 0.0001; right R = 0.8, P < 0.0001). (c, d) BP–BFV phase shifts during the Valsalva maneuver were smaller in hypertensive and stroke groups than in control group in both left and right MCAs (HTN: left p = 0.01, right P = 0.02; Stroke: left P = 0.003, right P = 0.003)

