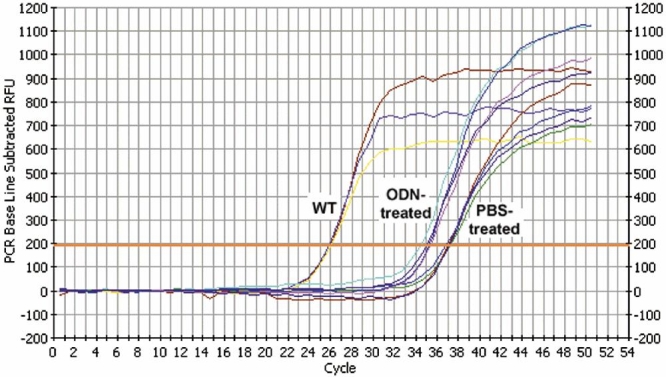
Figure 9.

Representative plots of allele specific real time polymerase chain reaction. The graph shows the real-time detection of fluorescence resulting from intercalation of SybrGreen fluorescent dye into double-stranded PCR products. Template DNA was isolated from BALB/c mouse (WT), retinas of rd1 mice treated with WTS oligonucleotide (ODN-treated), or retinas of rd1 mice treated with PBS (PBS-treated). Primers were specific for wild type allele. Each curve represents a different eye. Each experimental sample was assayed in 5-10 replicates. See "Materials and Methods" for details of detection threshold calculation (orange horizontal line), normalization, and quantification. Control experiments in which WT ODNs were doped into rd1 DNA show no shift to the left. Numerous experiments with rd1 DNAs isolated from many different individual mouse eyes all showed the typical curve of the PBS-treated samples crossing threshold at about 37 cycles.
