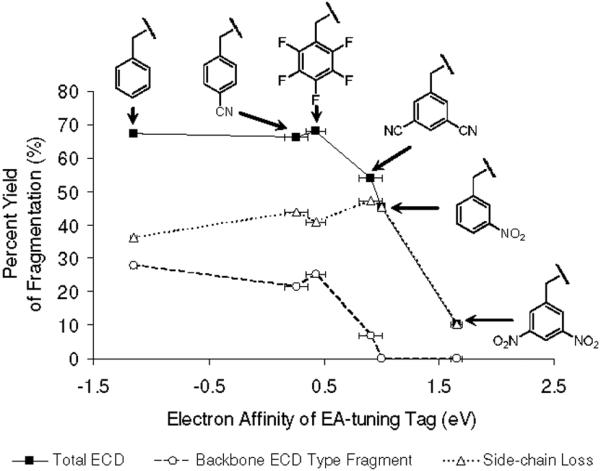
Figure 7.

Relationship between the electron affinities of the tags and percent yields of various ECD fragmentation channels, including total ECD (solid line), backbone ECD type fragment (dash line) and side-chain loss yield (dotted line), respectively. The horizontal error bars are taken from references for the electron affinities of tags in Ref. 49. Each isotope distribution of ions is summed and normalized followed by eq. 2-5.
