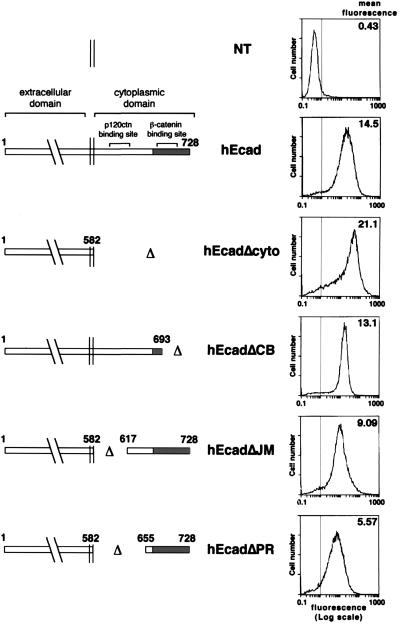
Figure 1.
Generation of stably transfected-cells expressing hEcad cytoplasmic variants. (Left) Schematic representation of hEcad and hEcad cytoplasmic variants. The double vertical bar represents the cytoplasmic membrane. Amino acids positions are indicated. (Center) Names of hEcad variants. (Right) FACS analysis of NT L2071 fibroblasts and stably transfected L2071 fibroblasts expressing hEcad or hEcad variants. Mean fluorescence after anti-hEcad and anti-mouse FITC-conjugated antibody labeling is indicated.

