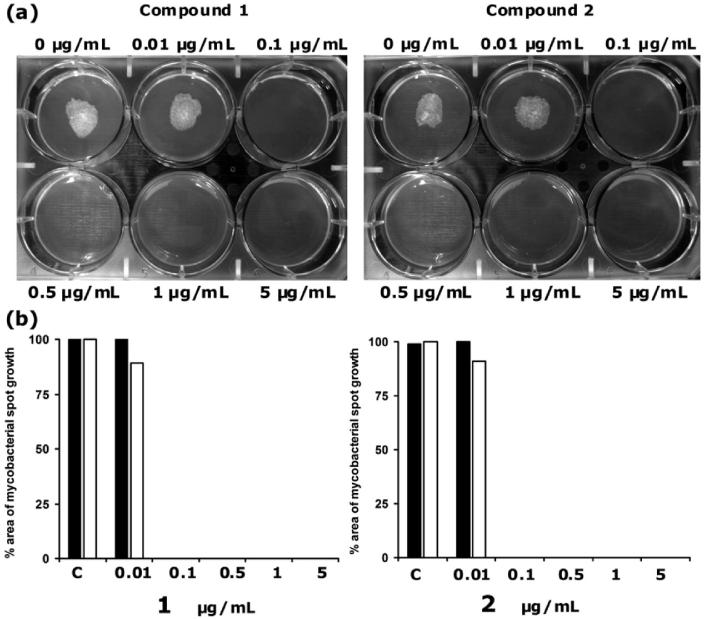
Figure 1.
Effect of 1 and 2 on the growth of mycobacteria. (a) Growth of M. bovis BCG on solid agar at 37 °C in the presence of different concentrations of compounds 1 and 2. The MIC values of compounds 1 and 2 are both 0.1 μg/mL (a) Approximately 103 M. bovis BCG cells were spotted on solidified Middlebrook 7H10 agar containing different concentrations of 1 and 2 (0.01, 0.1, 0.5, 1, and 5 μg/mL) in a six-well plate. Pictures of cultures that grew as spots were taken on the 14th day of inoculation using a BioDoc-ItTM imaging system. (b) M. tuberculosis H37Rv was grown in the presence of similar concentrations of 1 and 2 as in (a) above. A comparison of inhibitory effects of 1 and 2 on M. bovis BCG (black bars) versus M. tuberculosis H37Rv (open bars) is illustrated on the bar graphs.

