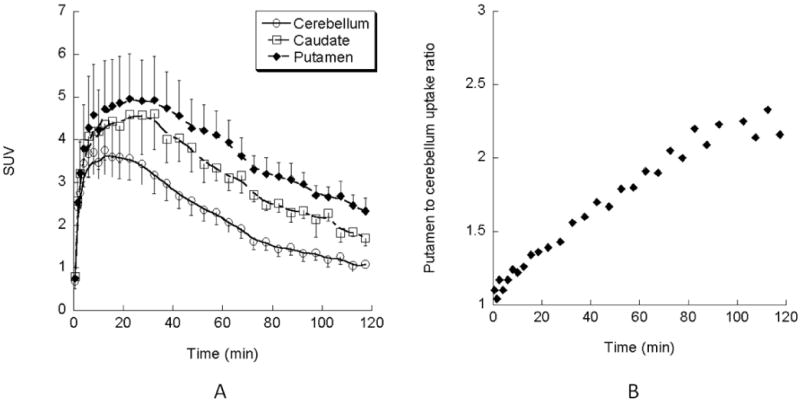
Figure 6.

(A) The tissue time-activity curves of (-)-[18F]9e in the monkey brain. Each point shows the SUV mean ± SEM in three monkeys. The uptake of (-)-[18F]9e in the brain reaches peak accumulation in the caudate and putamen at 30 min p.i. (B) The average striatum to cerebellum ratio of (-)-[18F]9e in three monkey brains. The ratio of striatum to cerebellum displays increasing activity in the striatum over time. At 2 h p.i., the striatum to cerebellum ratio reaches 2.1∼2.3 fold.
