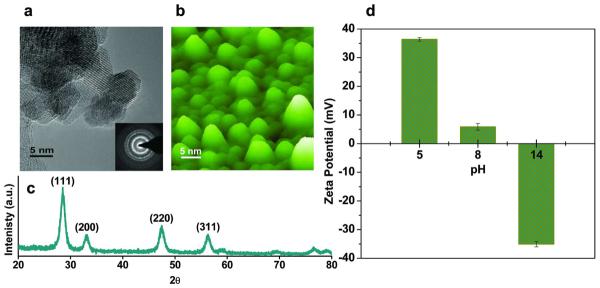
Figure 1.
Particle size, crystal structure and surface potentials of CNPs. (a) HRTEM (b) AFM image and (c) XRD spectrum of fluorite structured CNPs; (d) ZP plot of CNPs treated with different pH buffers. AFM and HRTEM images show that the CNP particle size is between 7 - 10 nm. XRD pattern and HRTEM images shows the presence of dominant (1 1 1) planes of cerium oxide fluorite structure. Positively charged CNPs were obtained by acidic buffer treatment (more H+ ions on surface) while basic buffer treatment (more OH- ions on surface) resulted in negatively charged CNPs. The isoelectric point (pl) is observed at 8.5. Each sample was analyzed 30 times (n=30) and the average values of ZP with standard deviation (mean±sd) are plotted here.

