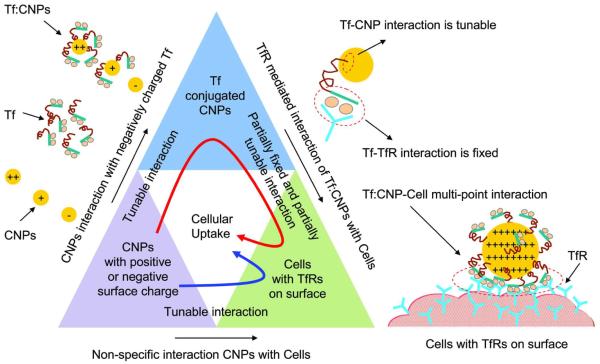
Figure 5.
Schematic diagram of interaction forces acting at different stages of cellular uptake. The triangle blocks show the interaction pathways of cellular uptake of CNPs. CNPs with strong positive charge show better adsorption of Tf. The interaction between Tf and CNPs can be tuned by protonation; however, the interaction of Tf with TfR is fixed. CNPs with a strong positive charge lead to enhanced Tf adsorption and multiple interactions with the TfRs on the cell surface. Red curved arrow inside the triangle blocks indicates the receptor mediated cellular internalization pathway of positively charged CNPs and blue curved arrow indicates the non-specific cellular internalization pathway of both positively and negatively charged CNPs. The red dashed circle represents the domain of multi-point interaction between Tf:CNP and TfRs on cell surface.

