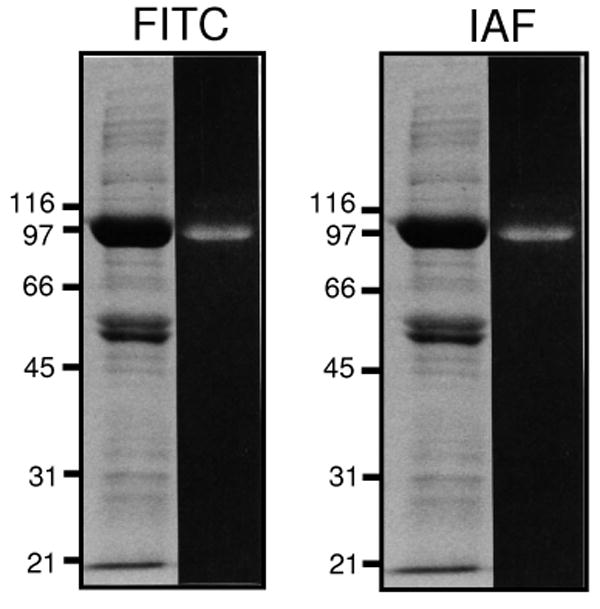
Figure 2. Specific Fluorescent Labeling of the Ca-ATPase.

Fluorescent signals (right lanes) and Coomassie blue protein stain (left lanes) for FITC-labeled (A) or IAF-labeled (B) proteins following SDS-PAGE (7.5% acrylamide) separation of microsomal proteins (50 μg) isolated from porcine ventricles. Positions of protein standards are indicated, which correspond to galactosidease (116 kDa), phosphorylase a (97 kDa), albumin (66 kDa), ovalbumin (45 kDa), carbonic anhydrase (31 kDa), and trypsin inhibitor (21 kDa).
