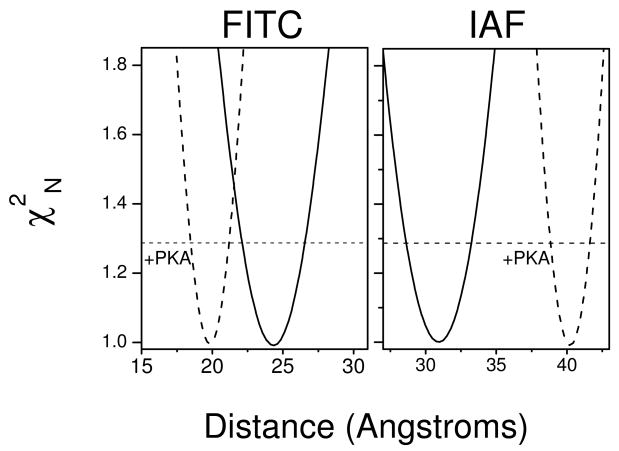
Figure 7. Phosphorylation of PLB Differentially Modifies Spatial Separation Between N- and P-Domains of Ca-ATPase Polypeptide Chains in Oligomeric Complex.
Depiction of error surfaces prior to (solid lines) or following (dashed lines) the phosphorylation of PLB by PKA for the distance (r) between FITC (left) or IAF (right) chromophores bound to proximal SERCA2a isoforms of the Ca-ATPase polypeptide chains labeled at Lys514 or Cys670, respectively. Normalized χ2N values were determined from nonlinear least-squares fits to the data depicted in Figure 5 following incremental adjustment of the spatial separation (distance) between either FITC (left) or IAF (right) chromophores. The horizontal dashed line at χ2N = 1.287 corresponds to the F-statistic, which represents one standard deviation relative to the best fit to the data. Experimental conditions are as described in the legend to Figure 5.

