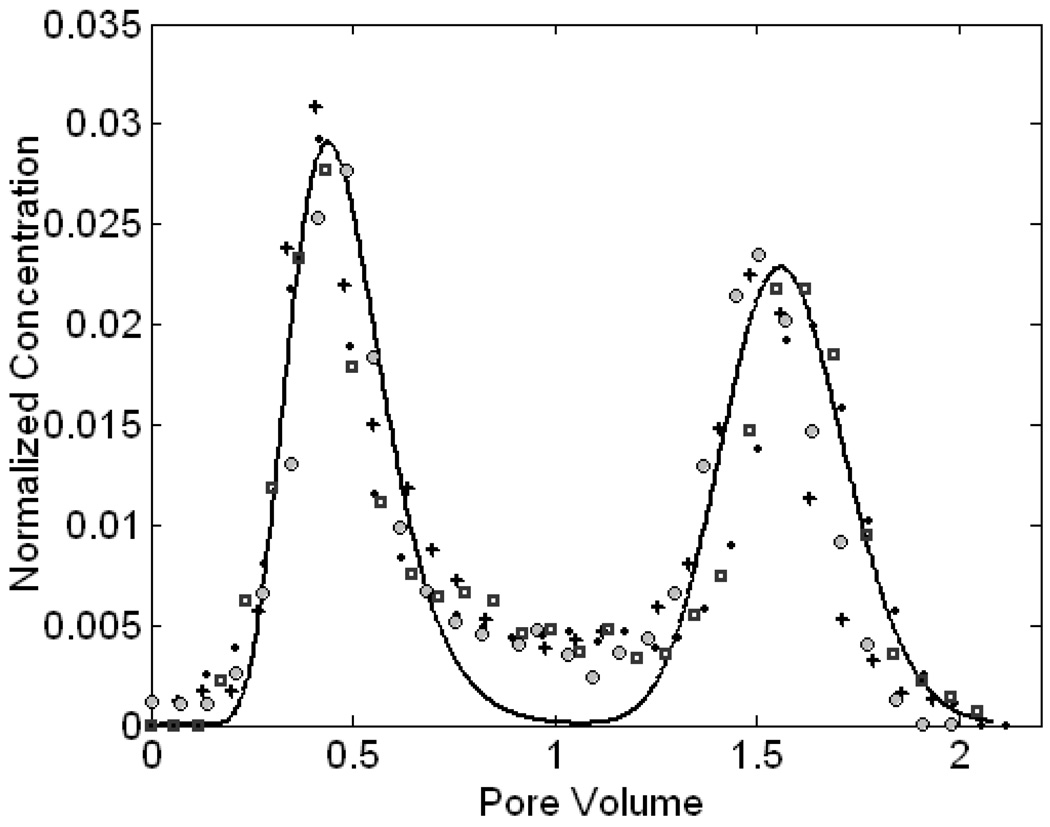
Figure 2.
BTC of the nitrate tracer at the flow velocity of 5.1 m/d. Nitrate concentrations are normalized to its initial concentration in the injectate. The sparse symbols represent all experimental data from four replicates with different symbols for each replicate and the bold line is the fitted simulated result from the one-dimensional mathematical model using the parameters listed in Table 1.

