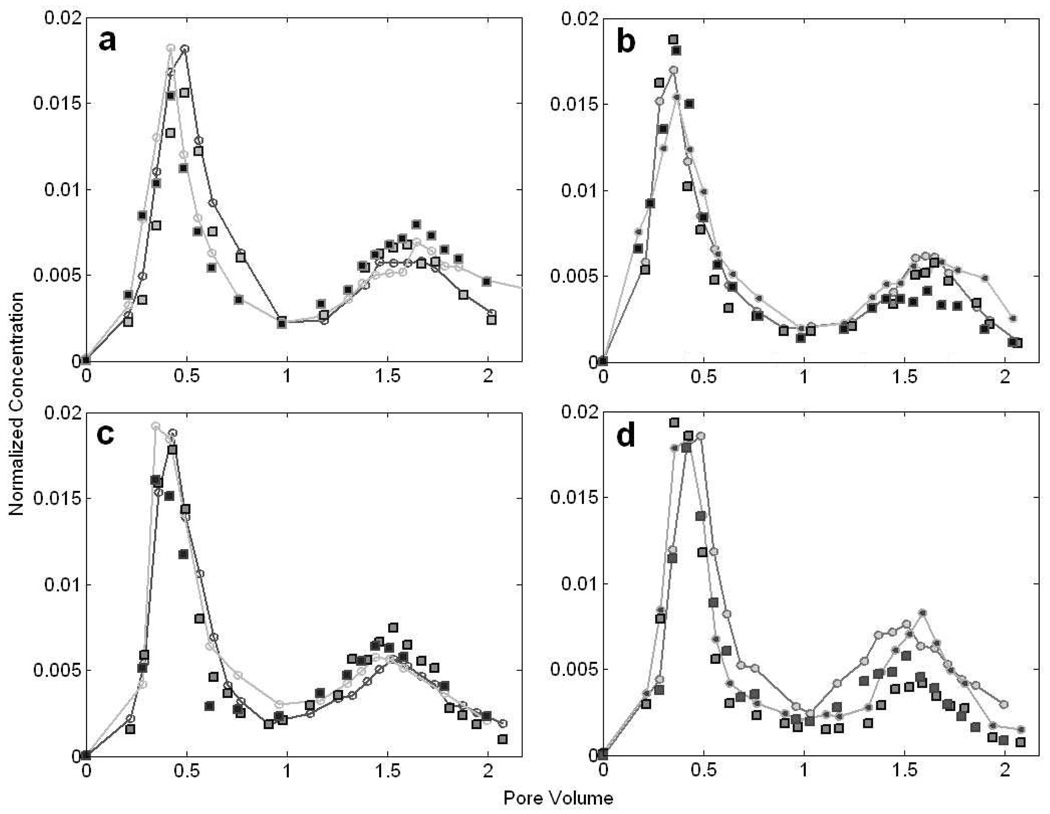
Figure 4.
BTCs of P. putida F1 at the flow velocity of 5.1 m/d. Bacterial and microsphere abundances are normalized to the initial concentrations in the injectates. The dots connected by lines represent the bacterial data and the squares are for the immobile particles. (a) BTCs of chemotactic bacteria and microspheres for an initial acetate concentration of 0.1 mM. (b) BTCs of nonchemotactic control and microspheres under the same condition as (a). (c) BTCs of chemotactic bacteria and microspheres for an acetate concentration of 1 mM. (d) BTCs of nonchemotactic control and microspheres under the same condition as (c). Data shown are two replicate experiments for each, as indicated by different symbols.

