
Figure 3.
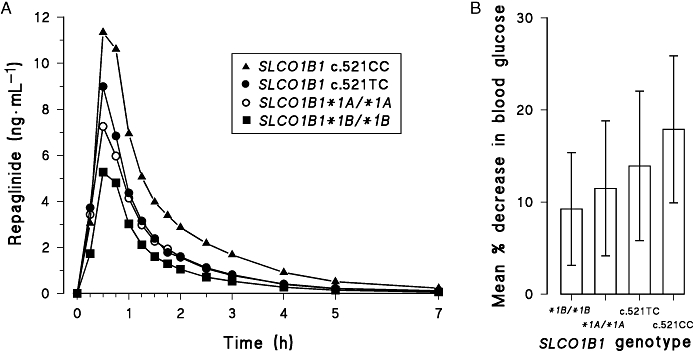
Mean plasma concentrations (A) and mean % decrease (±s.d.) in blood glucose 0–3 h (B) after ingestion of a single oral 0.5 mg dose of repaglinide in healthy participants with the SLCO1B1 c.521CC (n= 4, solid triangles), c.521TC (n= 12, solid circles), *1A/*1A (c.388AA-c521TT; n= 16, open circles) and *1B/*1B (c.388GG-c.521TT; n= 8, solid squares) genotypes. Modified from Kalliokoski et al., 2008a,c;.