
Figure 5.
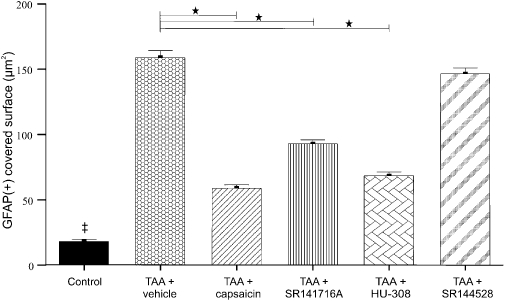
Quantitative evaluation of astrocytic activation in the brain samples illustrated in Figures 3 and 4. Activation of astrocytes was assessed by the area of glial fibrillary acidic protein (GFAP) staining and data represent the mean (with standard error mean) area covered by astrocytes per visual field in the hippocampus and cerebellum. The statistical test performed was the two-sided Fisher's exact test. ‡Significant difference (P < 0.001) between saline-treated controls and all other groups: *Significant difference (P < 0.001) between the group given thioacetamide (TAA) only and those given treatment after TAA (capsaicin or SR141716A or HU 308 or SR2144528).