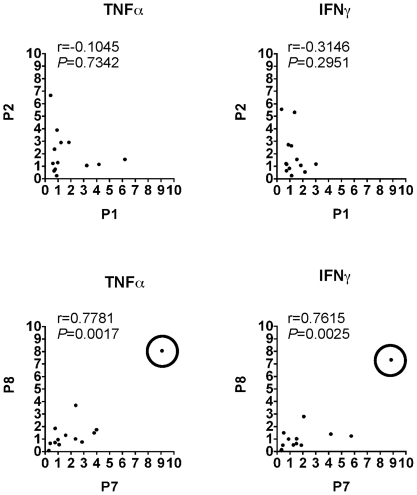
Figure 2. Correlation of proinflammatory cytokine response between HSP60/65-derived homolog pairs.
Logarithmic values of QRT-PCR results of each HSP60-derived pair were correlated using Pearson correlation, n = 13 and a 95% confidence interval. Circles enclosing data points are shown to indicate the patient excluded, in secondary analysis, to demonstrate that correlations are not due to outliers.

