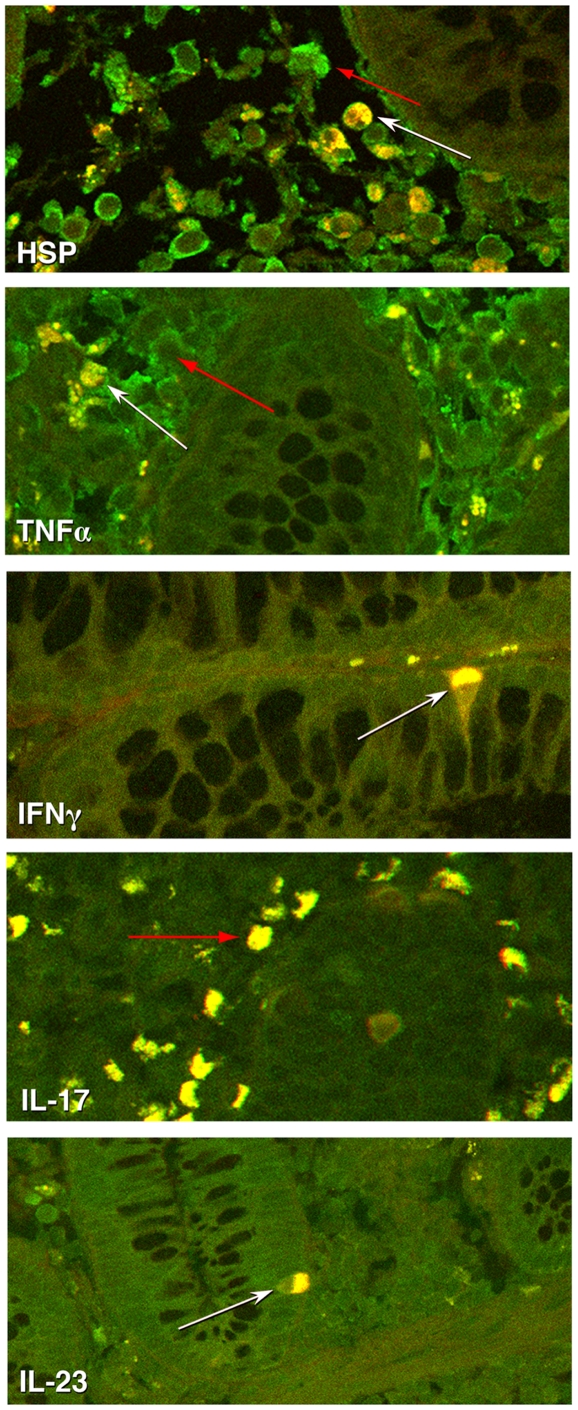
Figure 5. CD4 T cells produce TNFα, IFNγ, IL23 and HSP 60.
Immunohistochemical analysis of inflamed CD sections shows the colocalization of TNFα, IFNγ, IL23 and HSP60 with CD4. CD4 FITC (shown in green) and TNF〈, IFNγ, IL23, or HSP60 (shown in red) can be detected in inflamed sections. Additionally, IL-17 (shown in green) producing cells can be seen in inflamed sections. White arrows depict a representative double labeled cell and red arrows depict a representative single labeled cell.

