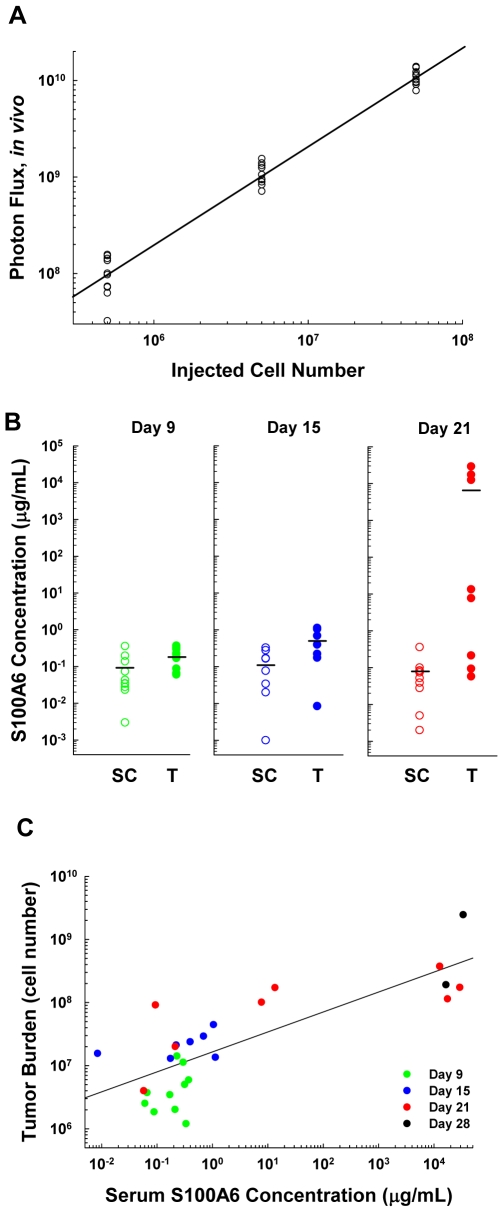
Figure 6. Detection of S100A6 in serum over time from mice with OVCA, in association with estimated peritoneal cavity tumor burden.
(A) Photon flux measurements obtained from mice harboring defined numbers of bioluminescent SKOV-3-Luc cells within the peritoneal cavity. Regression analysis was performed on (log10) photon output vs. (log10) numbers of inoculated cells to produce a standard calibration curve using an inverse prediction equation (see Materials and Methods). This was used to predict tumor burden from photon flux measurements (see also figure 6C). (B) Comparisons of serum S100A6 in tumor-bearing (T, closed circles) and saline-inoculated control mice (SC, open circles). Serum S100A6 concentrations, tested as individual specimens from multiple mice by ECLISA (plotted as individual values with horizontal line at median value), were significantly different between T vs. SC at each of three times tested post inoculation, 9 days (p = 0.015), 15 days (p = 0.036), and 21 days (p = 0.0031) (Wilcoxon Rank Sum test). (C) Correlation between estimate of tumor burden in OVCA carcinomatosis and concentration of serum S100A6, as measured by ECLISA from tumor-bearing mice (r = 0.79, p<0.0001).

