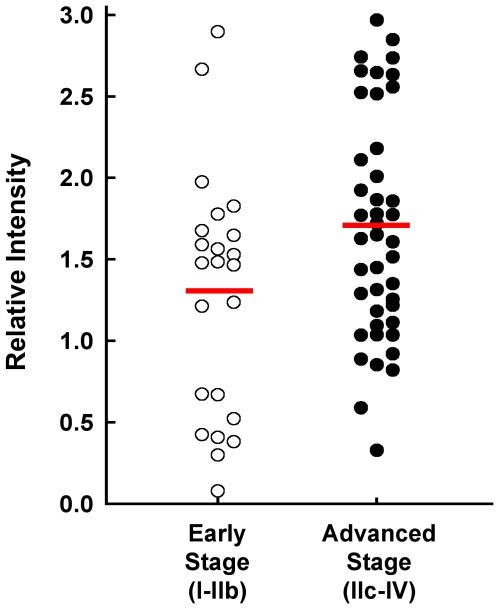
Figure 7. Reverse phase protein micorarray data obtained from the analysis of diagnostic sera from women with OVCA.
Scatterplot displays relative intensity of serum S100A6 values for women with early stage (open circles, n = 23) and advanced stage (closed circles, n = 43) OVCA. The early stage disease group includes 2 tumors diagnosed as borderline OVCA. The means of the relative intensity values of the analyte concentrations shown (horizontal lines) are significantly different for the two groups (p = 0.031, two-sample t-test), and depict relatively greater mean S100A6 concentration in sera of advanced stage patients.

