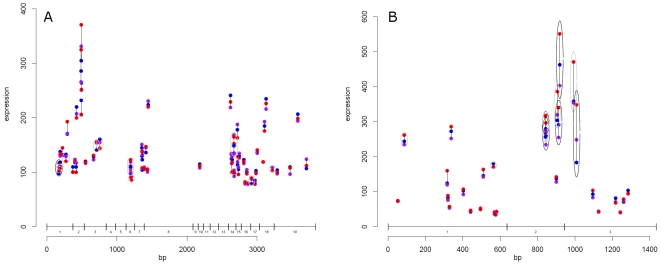
Figure 3. Detailed analysis of ANRIL in aorta tissue and CDKN2A in lymphoblastoid cell lines.
The x-axis denotes the mRNA position in bp of the gene investigated. Exon structure of the gene is shown immediately above the axis. The y-axis shows the hybridization intensity of probes on an arbitrary scale. Each triplet of dots indicates a probe, stratified by rs2891168 genotype. Grey circles denote relation to genotype under a linear additive model at P<0.2. Black circles show relation at P<0.05. A) ANRIL gene with UCSC accession uc003zpm.1 in the ASAP mammary artery data set. For each probe, the median of 29 AA samples are shown as blue dots, the median of 44 AG samples are shown as purple, and 15 GG samples are shown as red. B) CDKN2A gene with UCSC accession uc003zpj.1 with expression data from the GSE9372 lymphoblastoid HapMap cell line data set. For each probe the median expression of 36 biological samples with the AA genotype are shown as blue, 93 AG samples as purple, and 36 GG samples in red. Samples are from triplicate growths from the same individual, and therefore represent 12, 31, and 12 different individuals. Many probes around the exon 2 and 3 boundary are found to have p-values below 0.03. The same trend is seen when summarising triplicate values as mean, and investigating per individual. These figures are available as zoomable pdf-files in supplementary material S4 and S1. Biobank materials were extracted after informed consent from all participants were obtained, according to the declaration of Helsinki and approved by the ethical committee of the Karolinska Institute, journal numbers 02-147 and 2006/784-31/1.

