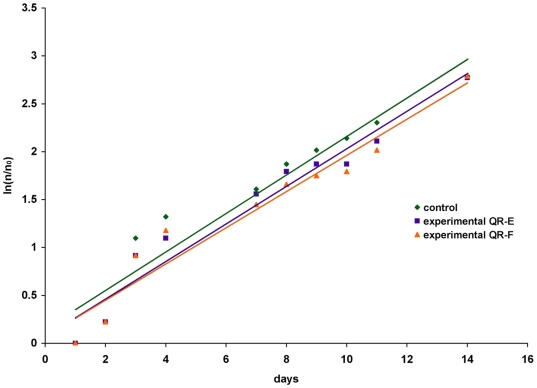
Figure 10. Influence of the QR treatment on Hydra population growth rate.
Population growth test started with a population of four full-grown Hydra, incubated 4 h with 10 nM QR-E (violet), QR-F (orange), washed and equilibrated in culture solution or not treated (green). The individuals were inspected daily and counted under a stereomicroscope. There are not significant differences between treated and untreated population growth rates. The logarithmic growth rate constant (k) is the slope of the regression line using the the standard equation of logarithmic growth: ln(n/n0) = kt.

