
Fig. 4.
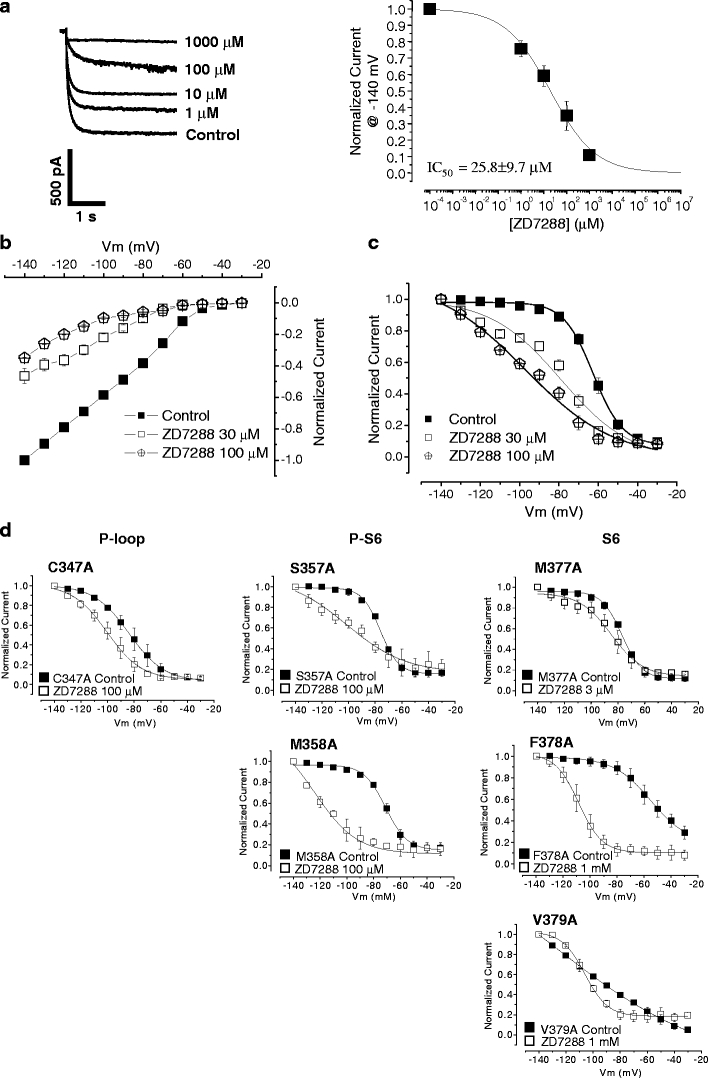
ZD7288 block of mHCN1 channels. a Representative current tracings and dose–response relationship for ZD7288 block of WT HCN1 channel. Normalized steady-state currents at −140 mV were plotted as a function of extracellular ZD7288 concentrations. Data points were fitted with a binding isotherm to estimate the IC50 for ZD7288 of the channel. b The steady-state current–voltage relationships of WT HCN1 channel in the absence and presence of ZD7288. c The corresponding steady-state activation curves for WT HCN1 channel. d The steady-state activation curves for the mutant HCN1 channels