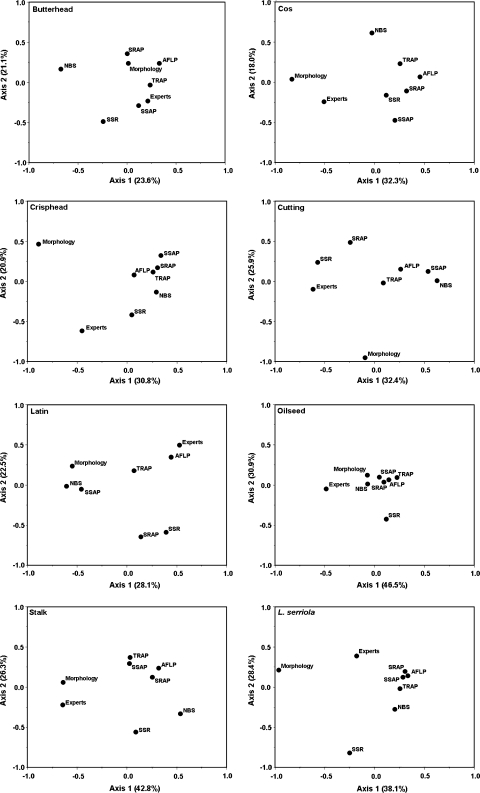
Fig. 3.
Principal co-ordinate plots illustrating the correlation between the characterisation methods for each of the main crop types of cultivated lettuce and L. serriola (see Material and methods for details on methodology). The percentage of variation explained by each of the two principal axes is denoted in parentheses in the axis legend

