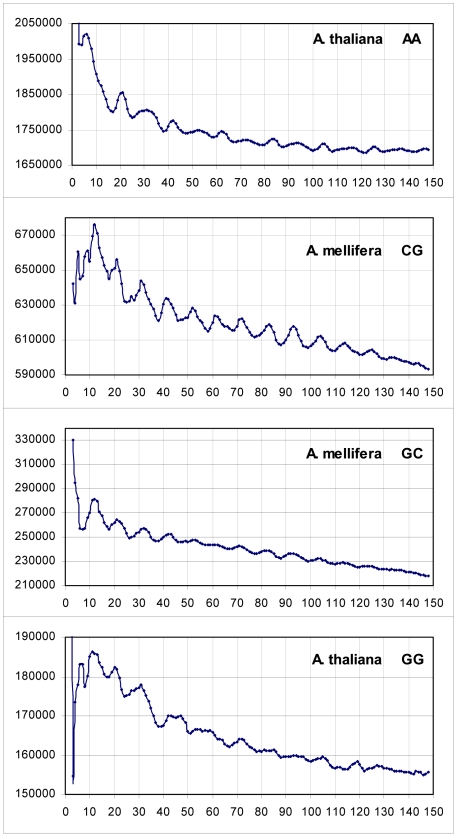
Figure 1. The four most prominent and clear dinucleotide periodicities amongst all thirteen genomes and dinucleotides analysed.
The counts in the histograms are smoothened by averaging over 3 bases. For each genome the total counts (Y axis) summed over all chromosomes entering the study are plotted as function of the distances (X axis) in the interval 1–150 bases.

