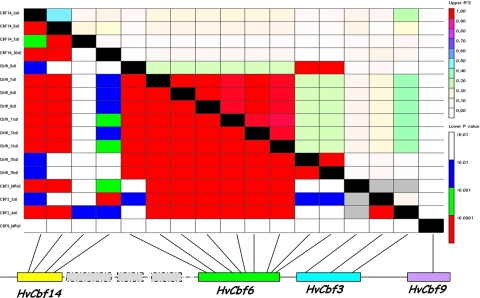
Fig. 2.
Linkage disequilibrium at CBF genes in modern and advanced cultivars. Each point in the LD matrix represents a comparison between a pair of polymorphic sites, with the r 2 values displayed above the diagonal and the P values for Fisher’s exact test below. The name of polymorphic sites and the colour codes for r 2 and P values are also reported. The LD threshold beyond two sites to declare them in disequilibrium was fixed at r² = 0.20 on the basis of the evaluation of LD among unlinked molecular markers (Breseghello and Sorrells 2006)

