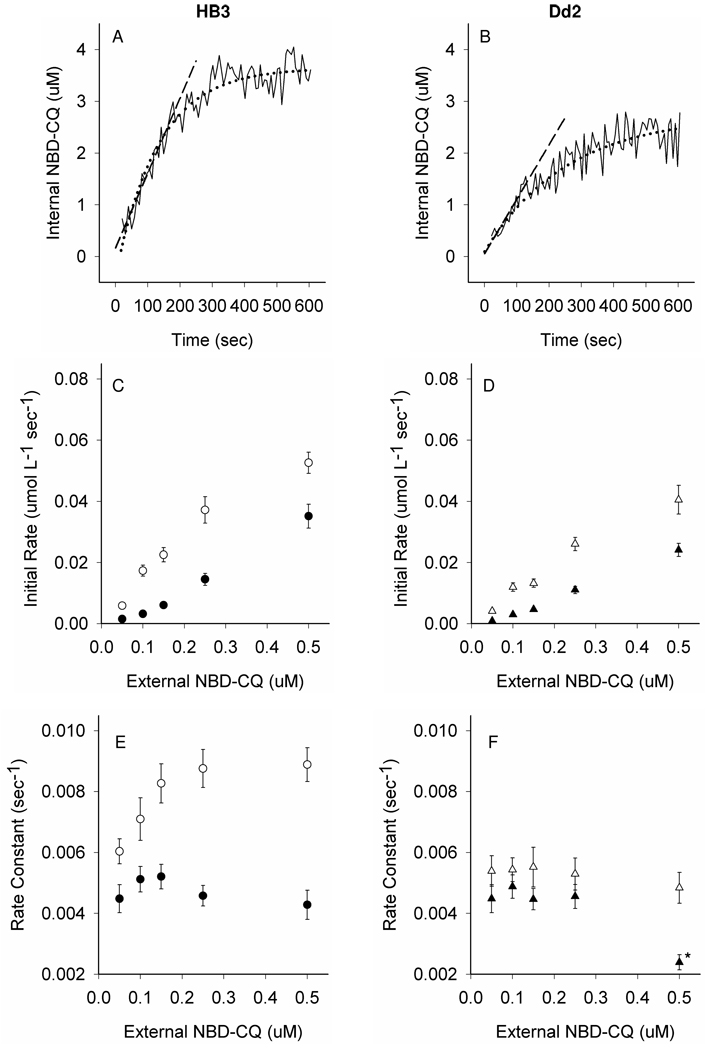
Figure 4. NBD–CQ influx under continuous perfusion.
(A, B) Representative accumulation traces and illustration of curve-fitting methods for 100 nM NBD-CQ influx in CQS HB3 (A) or CQR Dd2 (B) parasites under continuous perfusion with NBD-CQ as described in the text. Solid black lines show the raw data; accumulation (internal NBD-CQ on the y-axis) vs. time under perfusion with constant 100 nM NBD– CQ (x-axis). Black dashed lines represent linear curve fits to the first 60 sec (apparent initial rate) using y = mx + b. Black dotted lines show exponential curve fits for rate constant determinations using f = yo + a(1-e−bx), where the rate constant is “b”. Initial rates (C, D) and rate constants of influx (E, F) at various external NBD-CQ concentrations were measured in gas balanced HBSS with 5 mM D-Glucose (open symbols) vs. 5 mM D-Glucose substituted with 2 mM 2-Deoxy-D-glucose (filled symbols). (C) HB3 initial rates of influx with (○) and without glucose (●). (D) Dd2 initial rates of influx with (Δ) and without glucose (▲). (E) HB3 rate constants for influx with (○) and without glucose (●). (F) Dd2 rate constants for influx with (Δ) and without glucose (▲). Each point is the average of >20 parasites from at least 5 independent perfusion experiments. All error bars were calculated from the standard error of the mean (SEM). One set of experimental conditions for Dd2 (marked with *) repeatedly led to ambiguous rate constant calculation since, despite many attempts, the accumulation traces in these experiments did not provide a clear plateau within 15–20 minutes. This phenomenon (seen only at higher [NBD-CQ]) will be explored elsewhere.

