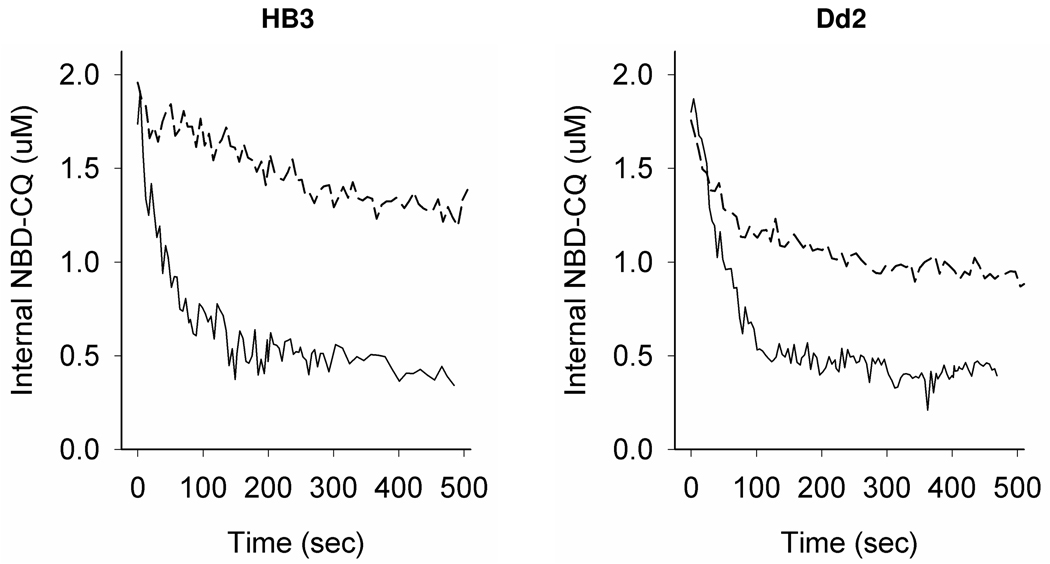
Figure 5. NBD – CQ efflux in live intraerythrocytic P. falciparum.
Shown are representative traces for NBD-CQ efflux from live CQS HB3 (left) and CQR Dd2 (right) parasites. Preloading conditions were by incubation of low inoculum iRBC with 30 or 50 nM NBD-CQ (for HB3 or Dd2, respectively) in HBS for 1 hr (top trace, each panel) and with 250 or 500 nM NBD-CQ (for HB3 or Dd2, respectively) for 1 min under perfusion with HBSS (bottom trace each panel). The incubating concentrations were chosen such that total internal probe would be equivalent for both the CQS and CQR strain. For cells pre-loaded with NBD-CQ for 1 hr, efflux was initiated by perfusion with HBS at 37 °C (top trace each panel, broken line) similar to many previous studies. For cells preloaded via a short pulse with NBD-CQ, efflux was initiated by immediately switching to HBSS (bottom trace each panel, solid lines).

