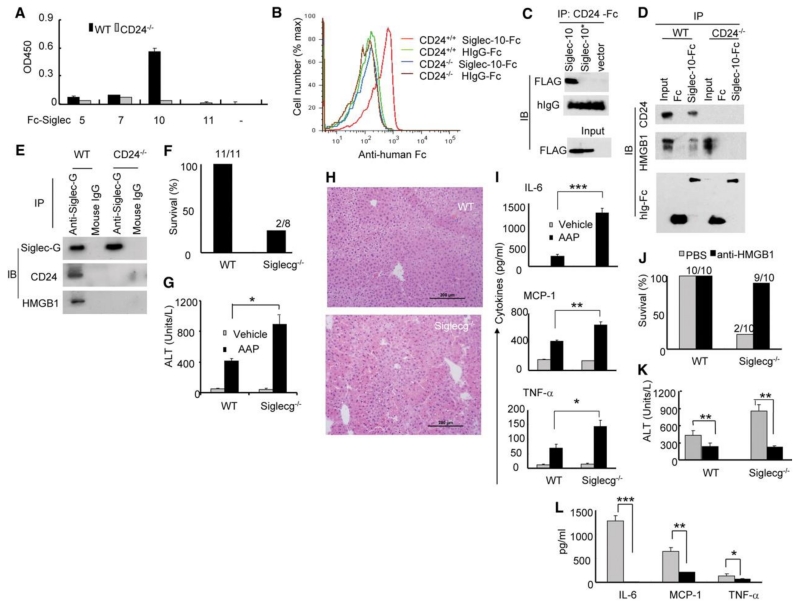
Fig. 3.
The Siglec 10/G-CD24-HMGB1 axis negatively regulates immune responses to AAP-induced liver injury. (A) Interaction between CD24 and Siglec-Fc fusion proteins. Data shown are optical density and have been repeated 3 times. (B) Flow cytometric analysis of CD24 interaction with Siglec-10. Representative histograms of two independent experiments are shown. (C) COS cells were transfected with FLAG-tagged WT or mutant (*, R119A) Siglec-10 cDNA or a vector control. Coimmunoprecipitations were performed 48 hours later. (D) Lysates from WT or CD24-/- splenocytes were used to coimmunoprecipitate Siglec-10-Fc, CD24 and HMGB1. (E) Lysates from WT and CD24-/- spleen cells were precipitated with either Siglec-G antibodies or control mouse Ig. The precipitates were probed with Siglec-G antisera and mAbs specific for CD24 and HMGB1. (F) Percent survival 20 hours after AAP treatment. Numbers on graph represent the number of surviving mice over total mice used. (G) ALT release in serum 6 hours after AAP treatment (mean ± SD, *P < 0.005, n=5). (H) 20x images of H&E staining of livers harvested 6 hours after AAP injection. (I) Cytokine production in blood measured 6 hours after AAP treatment (mean ± SD, n=5. *P <0.05, **P < 0.009, ***P < 0.002). (J) Survival of WT and Siglecg-/- mice 20 hours after treatment. (K) ALT release in the blood 6 hours after treatment (mean ± SD, n = 5, *P < 0.006). (L) Cytokine release in the blood 6 hours after treatment (mean ± SD, n = 5, *P < 0.03, **P < 0.0006, ***P < 0.0004). (K-L) are representative of two independent experiments. Statistical significance was determined by the student’s t-test.

