


Fig 2.
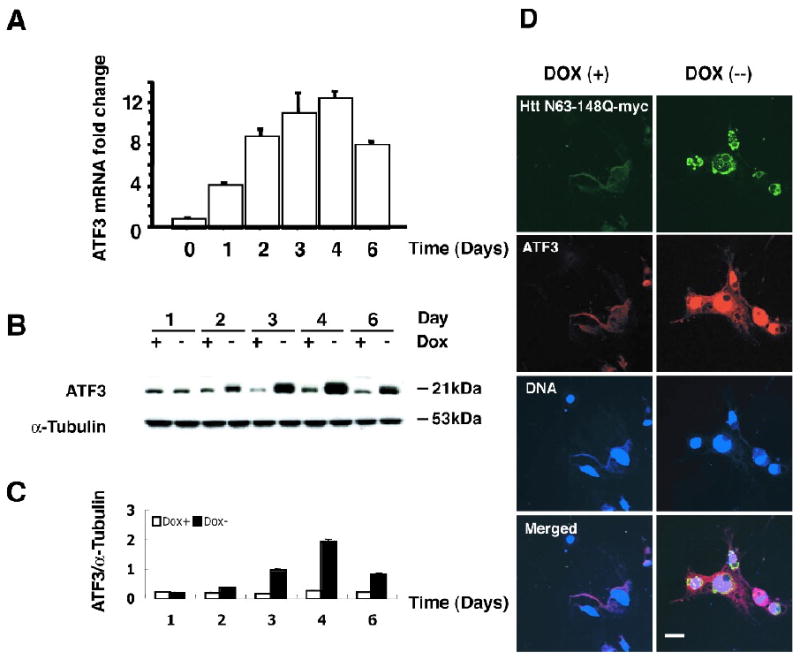
Mutant Htt-N63 increases ATF3 mRNA and protein levels. (A) RT-qPCR analysis was carried out in the presence or absence of mutant Htt-N63 expression. Data are reported fold as a-fold increase in ATF3 mRNA in Htt-expressing cells (Dox-) compared to the un-induced condition (Dox+) and show a peak in ATF3 mRNA 4 days after induction of mutant Htt expression. (B) Western blot analysis of endogenous ATF3 levels following induction of Htt N63-148Q-myc expression shows an increase in ATF3 over time, with a peak on day 4 after induction. Blots were probed with an antibody to ATF3. α-Tubulin is shown as a loading control. (C) Quantification of these data is shown in the lower panel. (D) Confocal images of Htt N63-148Q-myc stable inducible cells showing myc epitope (green), ATF3 (red), and Hoescht (blue) staining in the absence (Dox+, upper panels) or presence (Dox-, lower panels) of mutant Htt expression. Cells were fixed and immunostained 4 days after induction of mutant Htt expression. (Scale bar: 10μm)