
Figure 1.
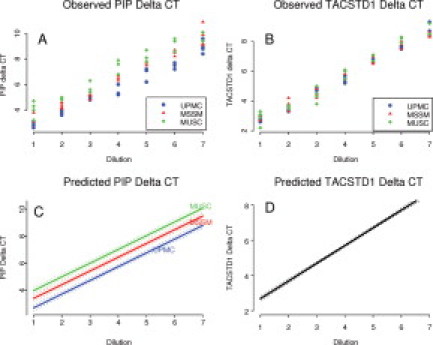
Observed and predicted PIP and TACSTD1 relative expression from intralaboratory reproducibility experiments. Synthetic LN samples representing seven serial dilutions (four samples for each dilution) were sent to three participating laboratories. The objective was to assess assay reproducibility between and within laboratories. A and B: Observed target mRNA concentrations in ΔCt as determined by UPMC, MSSM, and MUSC laboratories. C: The estimated concentration-dilution curve based on a linear regression model. This model supports a separate function for each laboratory that differs by vertical distance and not by slope. D: The best fitting regression model for TACSTD1 permits a single concentration-dilution function for all laboratories. Dotted lines in C and D are 95% confidence bands for the expected ΔCt.