
Figure 4. NaHCO3- (□) and NaCl-induced (
 ) changes in renal blood flow, panel A, and renal vascular resistance (RVR), panel B, in salt-resistant (SR) and salt-sensitive (SS) subjects.
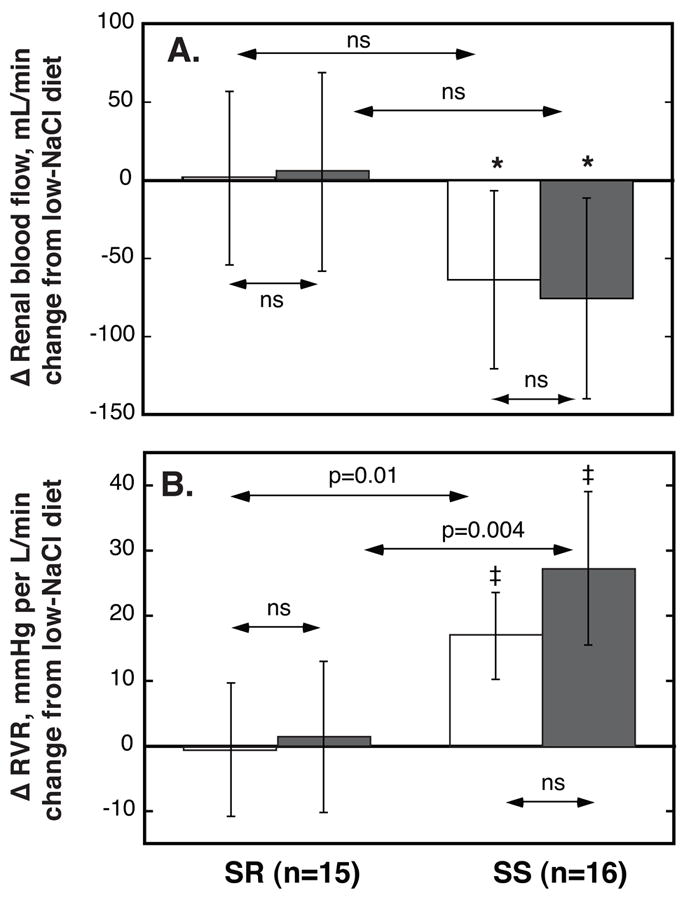
Values are average changes from day 7 of low-NaCl to day 7 of Na+-loading periods. Values are means, error bars are 95% C.I. P values for within-group comparisons of Na+-loading vs low-NaCl period: ★P<0.05; †, P<0.01; and ‡ P<0.001; respectively. In SS but not in SR NaHCO3 and NaCl induced decreases in RBF and increases in RVR. The changes in both variables were similar with the two salts.