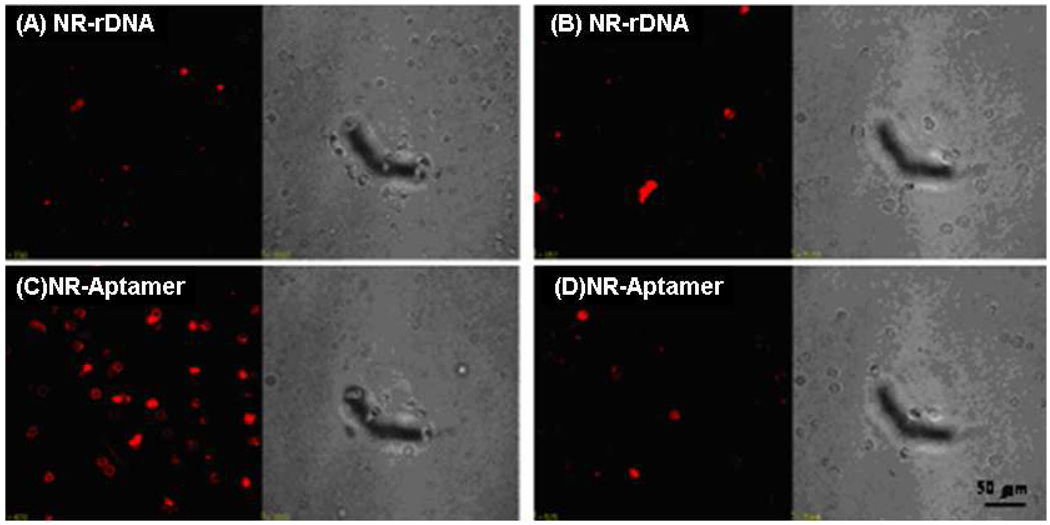
Figure 2.
Binding assay of nanorod-aptamer conjugates (NR-Aptamer) towards target cells (C) and control cells (D). The confocal images of target cells (A) and control cells (B) stained by random DNA conjugated nanorod (NR-rDNA) show less fluorescence. The scale bars are 50µm. Fluorescence images (left) and optical images (right). Adapted from ref 45.

