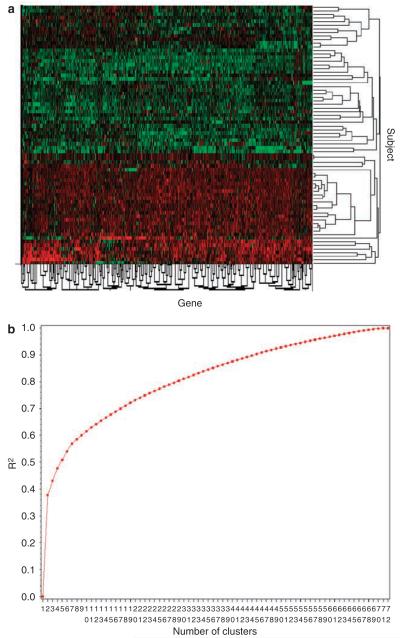
Figure 1.
Cluster analysis of gene expression data reveals two distinct subgroups of obesity. Microarrays were used to measure gene expression in both adipose tissue and skeletal muscle in a population of 72 healthy obese patients. On the basis of the ratio of adipose to skeletal muscle tissue gene expression, the subjects were clustered into two distinct subgroups (see text for details), which are represented as a heat map (Figure 1a). Heat maps depict the variations in the expression of genes across patients and are shown in red (downregulated) or green (upregulated) for each gene and each subject. The decision to limit the clusters to two categories was based on the power curve (Figure 1b), which shows a trivial increase in power as the number of clusters increases. Power was determined as the goodness of fit, R2, for each iteration of the clustering; that is, the amount of variance explained with the addition of subsequent principal components.

