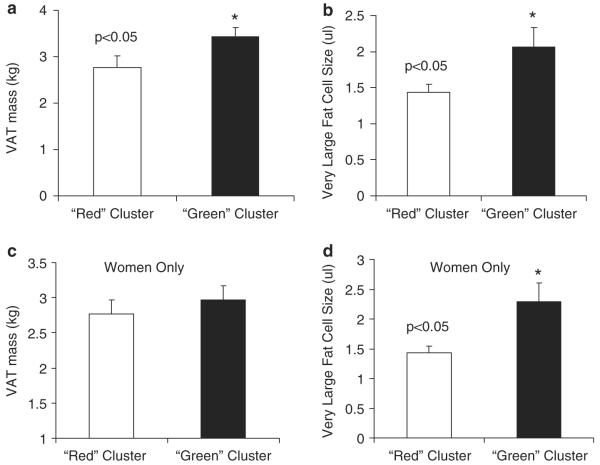
Figure 4.
Cluster dimorphism in visceral adipose tissue and very large fat cell size. Gene expression was measured in both adipose and skeletal muscle tissue in a population of 72 healthy obese patients using microarrays. On the basis of their gene expression profile, subjects were clustered into two distinct subgroups of either `green' or `red'. All eight men were grouped into the `green' cluster based on their gene expression profile. Visceral adipose tissue (VAT) mass (a) and very large fat cell size (b) were significantly different between the `green' and `red' clusters. These relationships were reanalyzed without the men and VAT mass (c) was no longer different, but very large fat cell size (d) remained significantly different in the `green' and `red' clusters.

