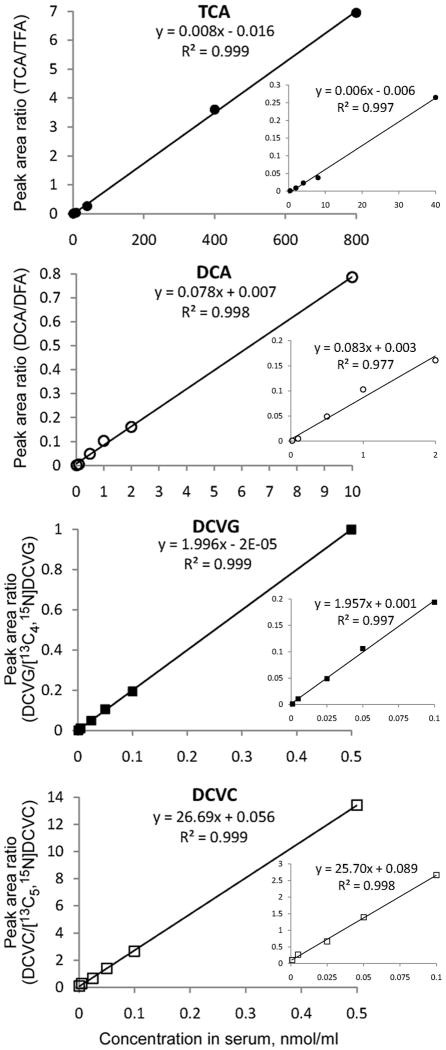
Fig. 6.
Calibration curves of the analytes trichloroacetic acid (TCA, ●), dichloroacetic acid (DCA, ○), S-(1,2-dichlorovinyl)glutathione (DCVG, ■), and S-(1,2-dichlorovinyl)-L-cysteine (DCVC, □). Full range (large graphs), as well as low concentration range (inset graphs), calibration curves are shown.

